
Reports
Click Reports in the left-hand bar. Pick a report at the top left and a date range at the top right: Last 7 days, Last 30 days, This month or Custom. The dates used are shown under the tabs.
Performance
How the deliveries went, day by day.
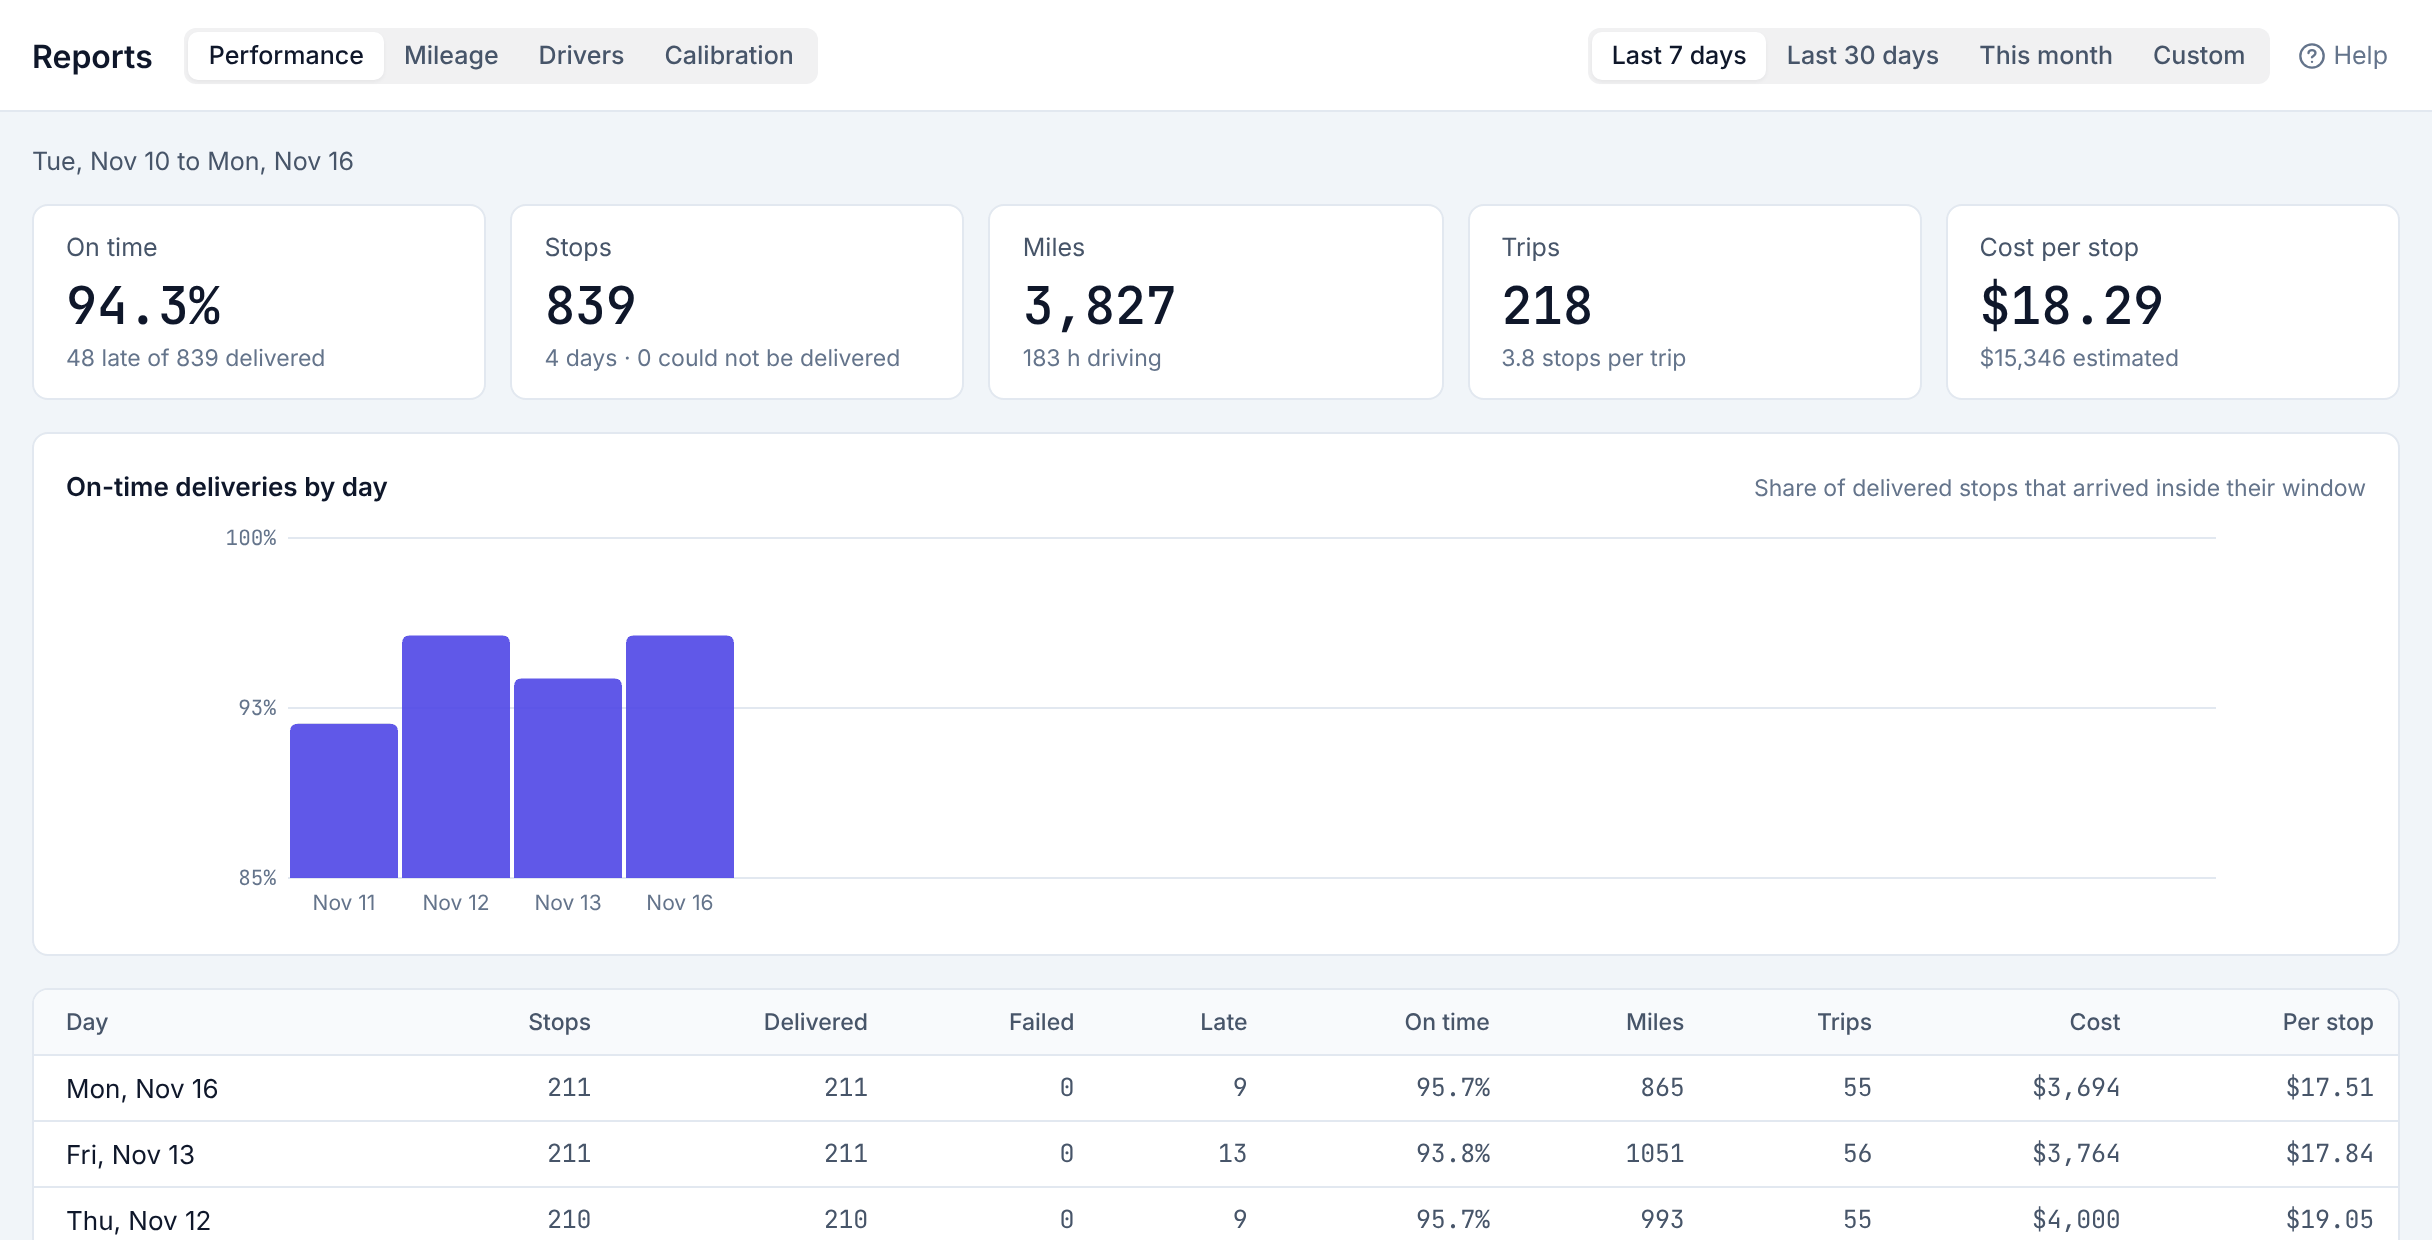
- On time: the share of delivered stops that arrived inside their window, with how many were late.
- Stops: all stops, and how many could not be delivered.
- Miles and hours of driving, Trips and stops per trip.
- Cost per stop: the estimated cost (paid driver time from first departure to last return, plus miles at each vehicle's rate) divided by stops.
The chart shows the on-time share per day (its scale runs from 70% to 100%), and the table under it the same figures per day.
Mileage
Miles per driver, and what is owed to drivers who used their own car.
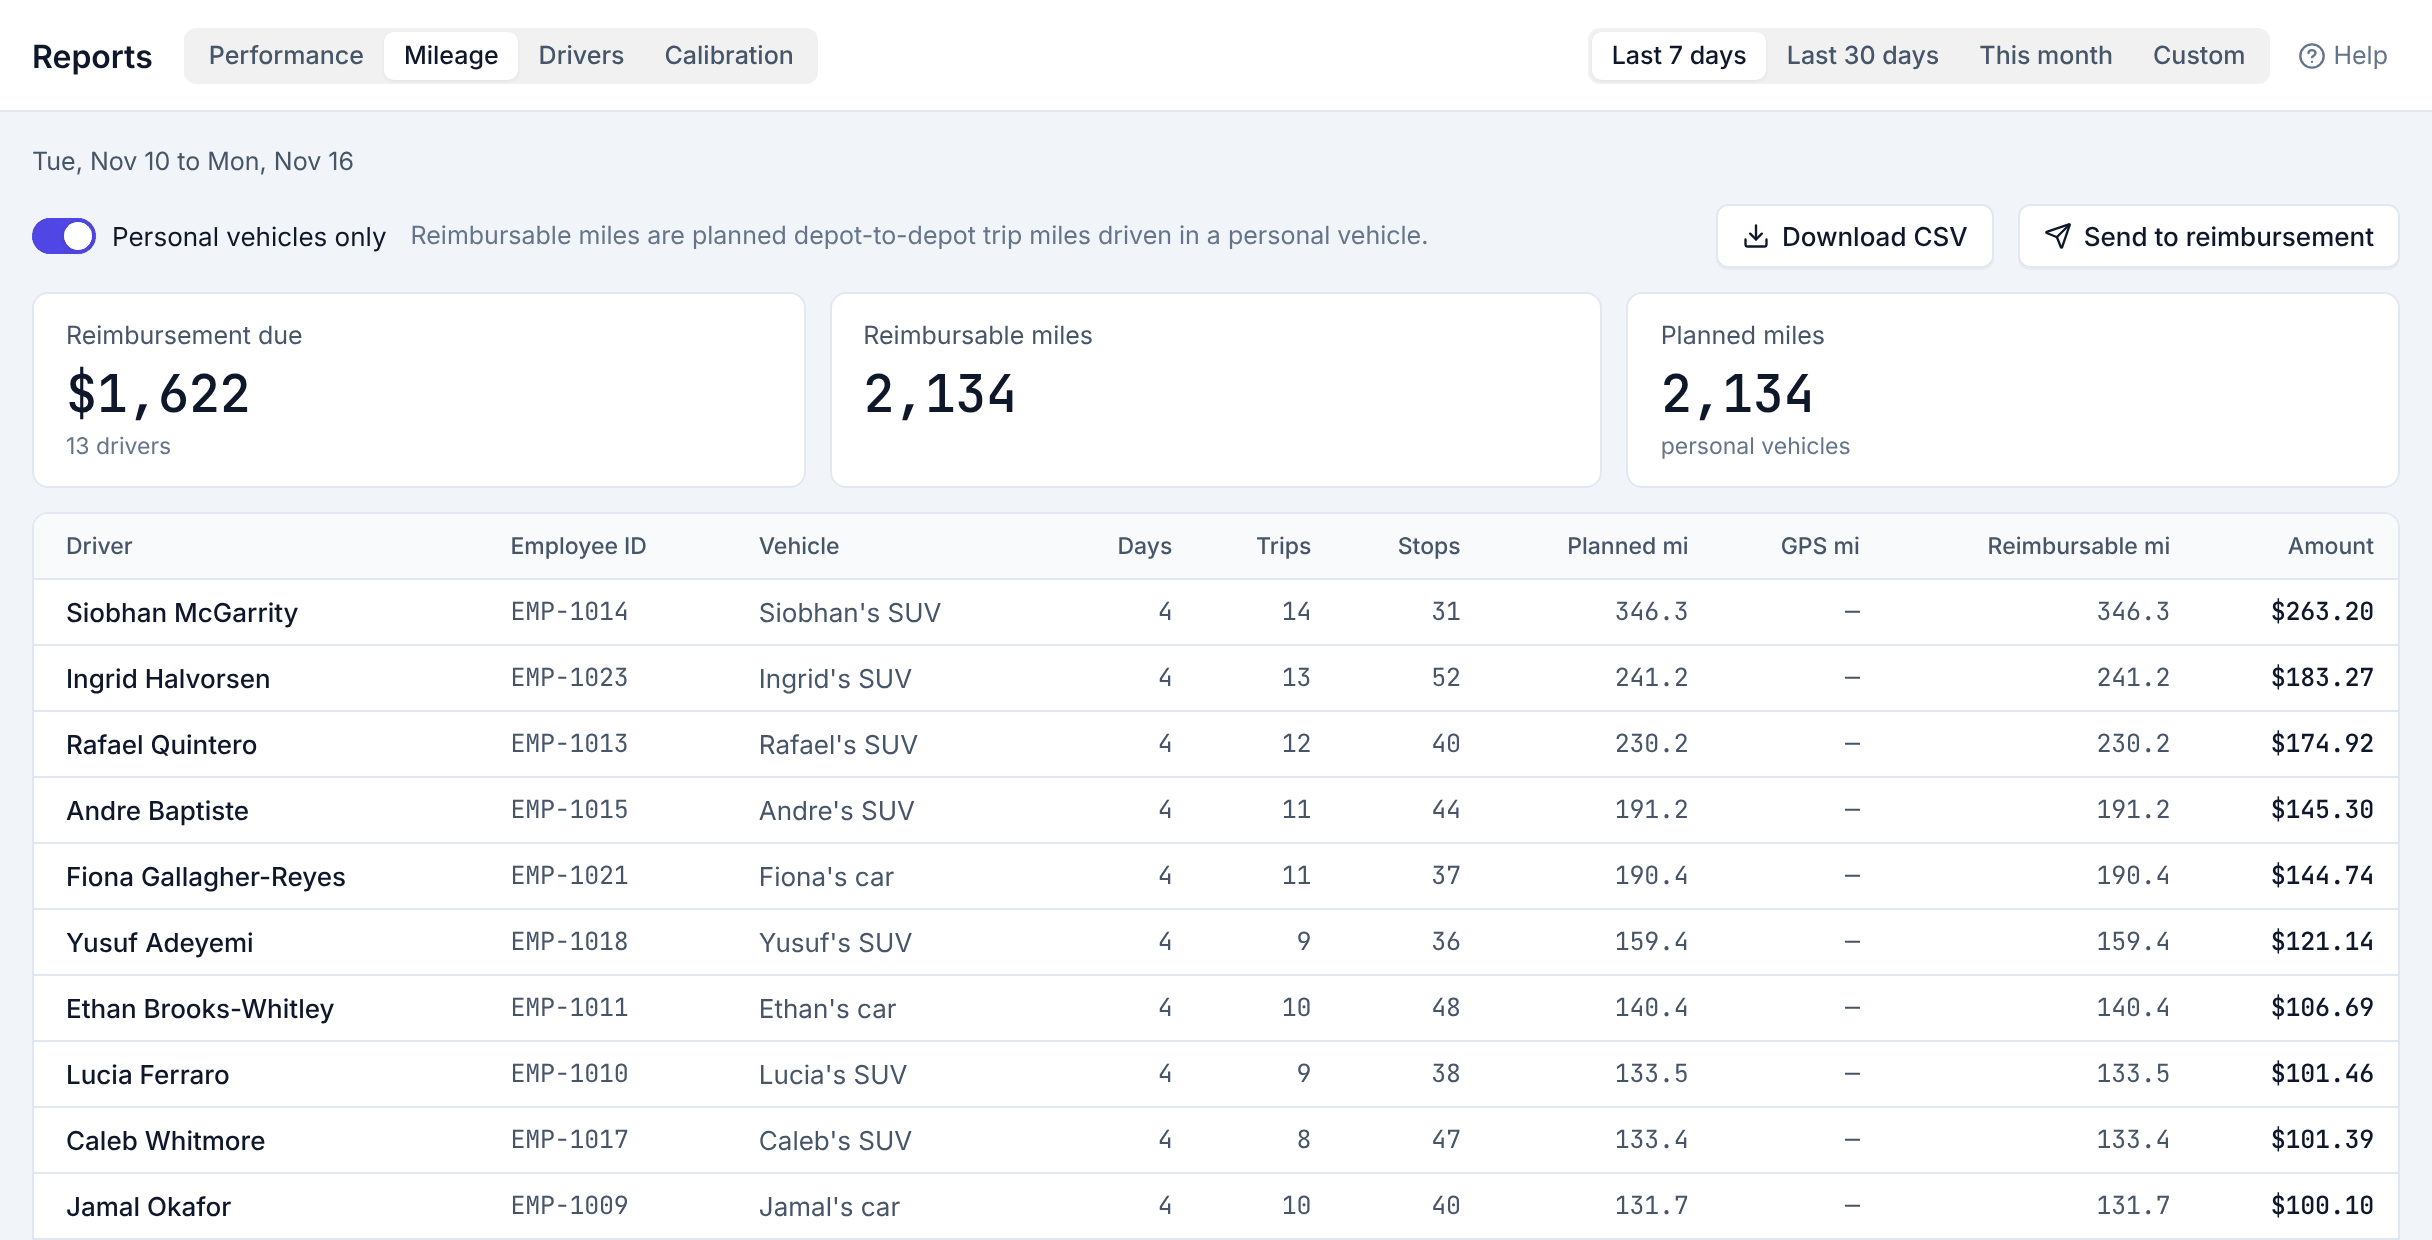
- Reimbursable miles are the planned miles of trips driven in a personal vehicle, from the kitchen and back. (An admin can switch this to GPS miles, see Planning defaults.)
- Amount is reimbursable miles × the driver's mileage rate (or the company rate).
- Personal vehicles only hides company vehicles. Turn it off to see every vehicle's miles.
- Download CSV saves the rows for payroll.
- Send to reimbursement posts them to the reimbursement system your server is connected to, after you confirm. A message says whether it worked.
Drivers
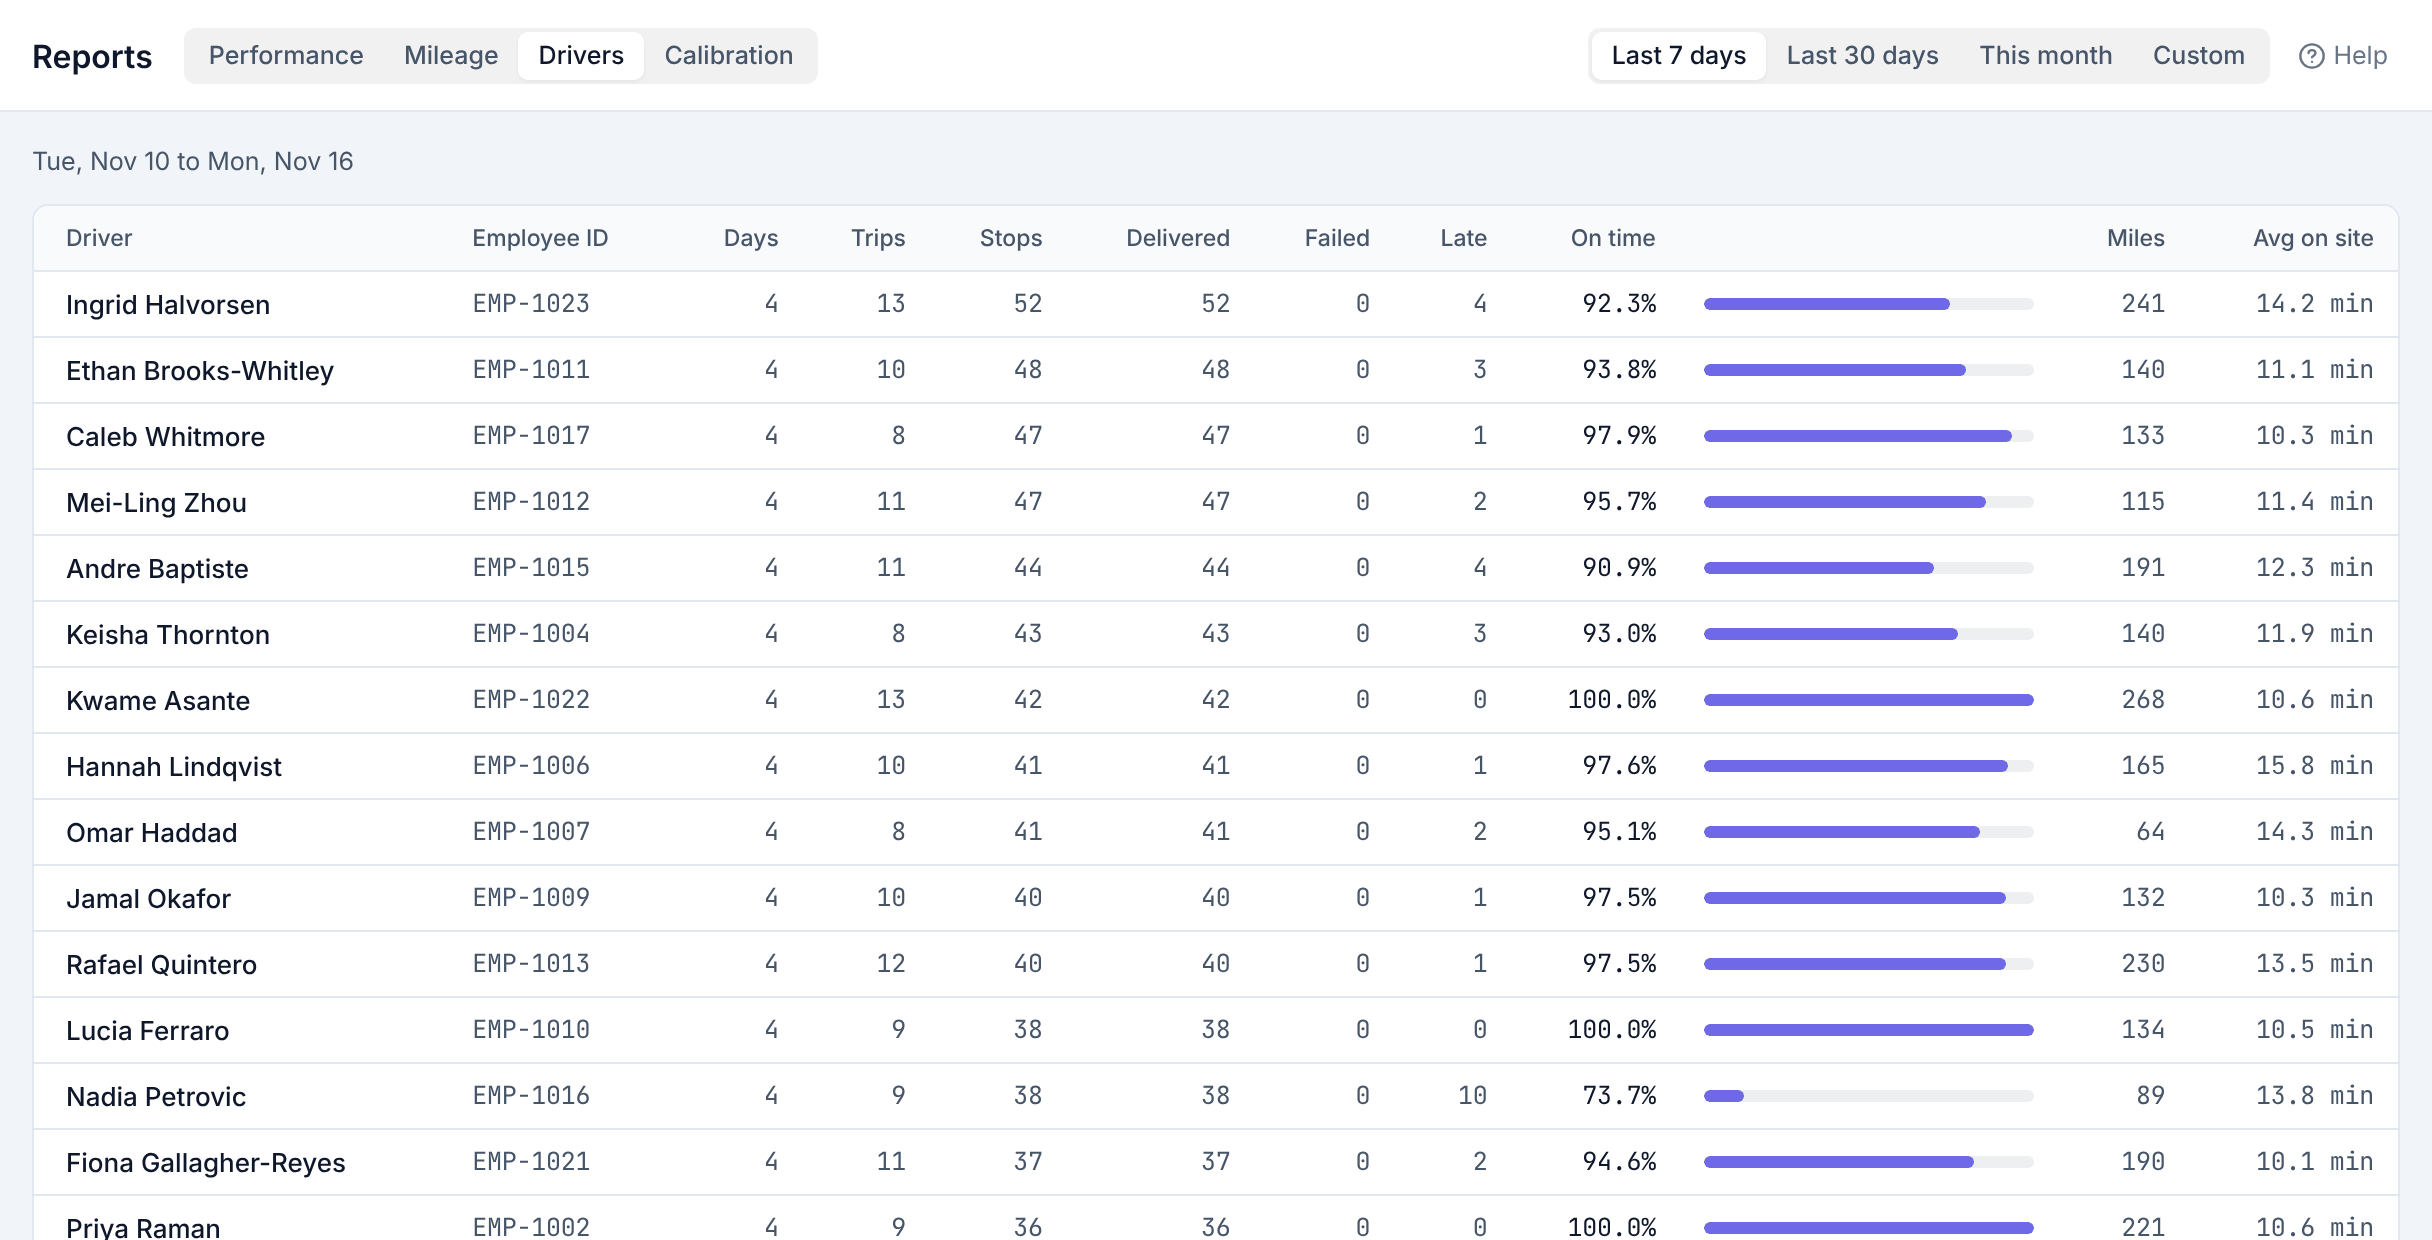
One row per driver for the range: days worked, trips, stops, delivered, failed, late, on-time share (with a bar from 70% to 100%), miles, and average time on site.
Calibration
Routisserie compares what was planned with what drivers actually did, so the plans get better over time.
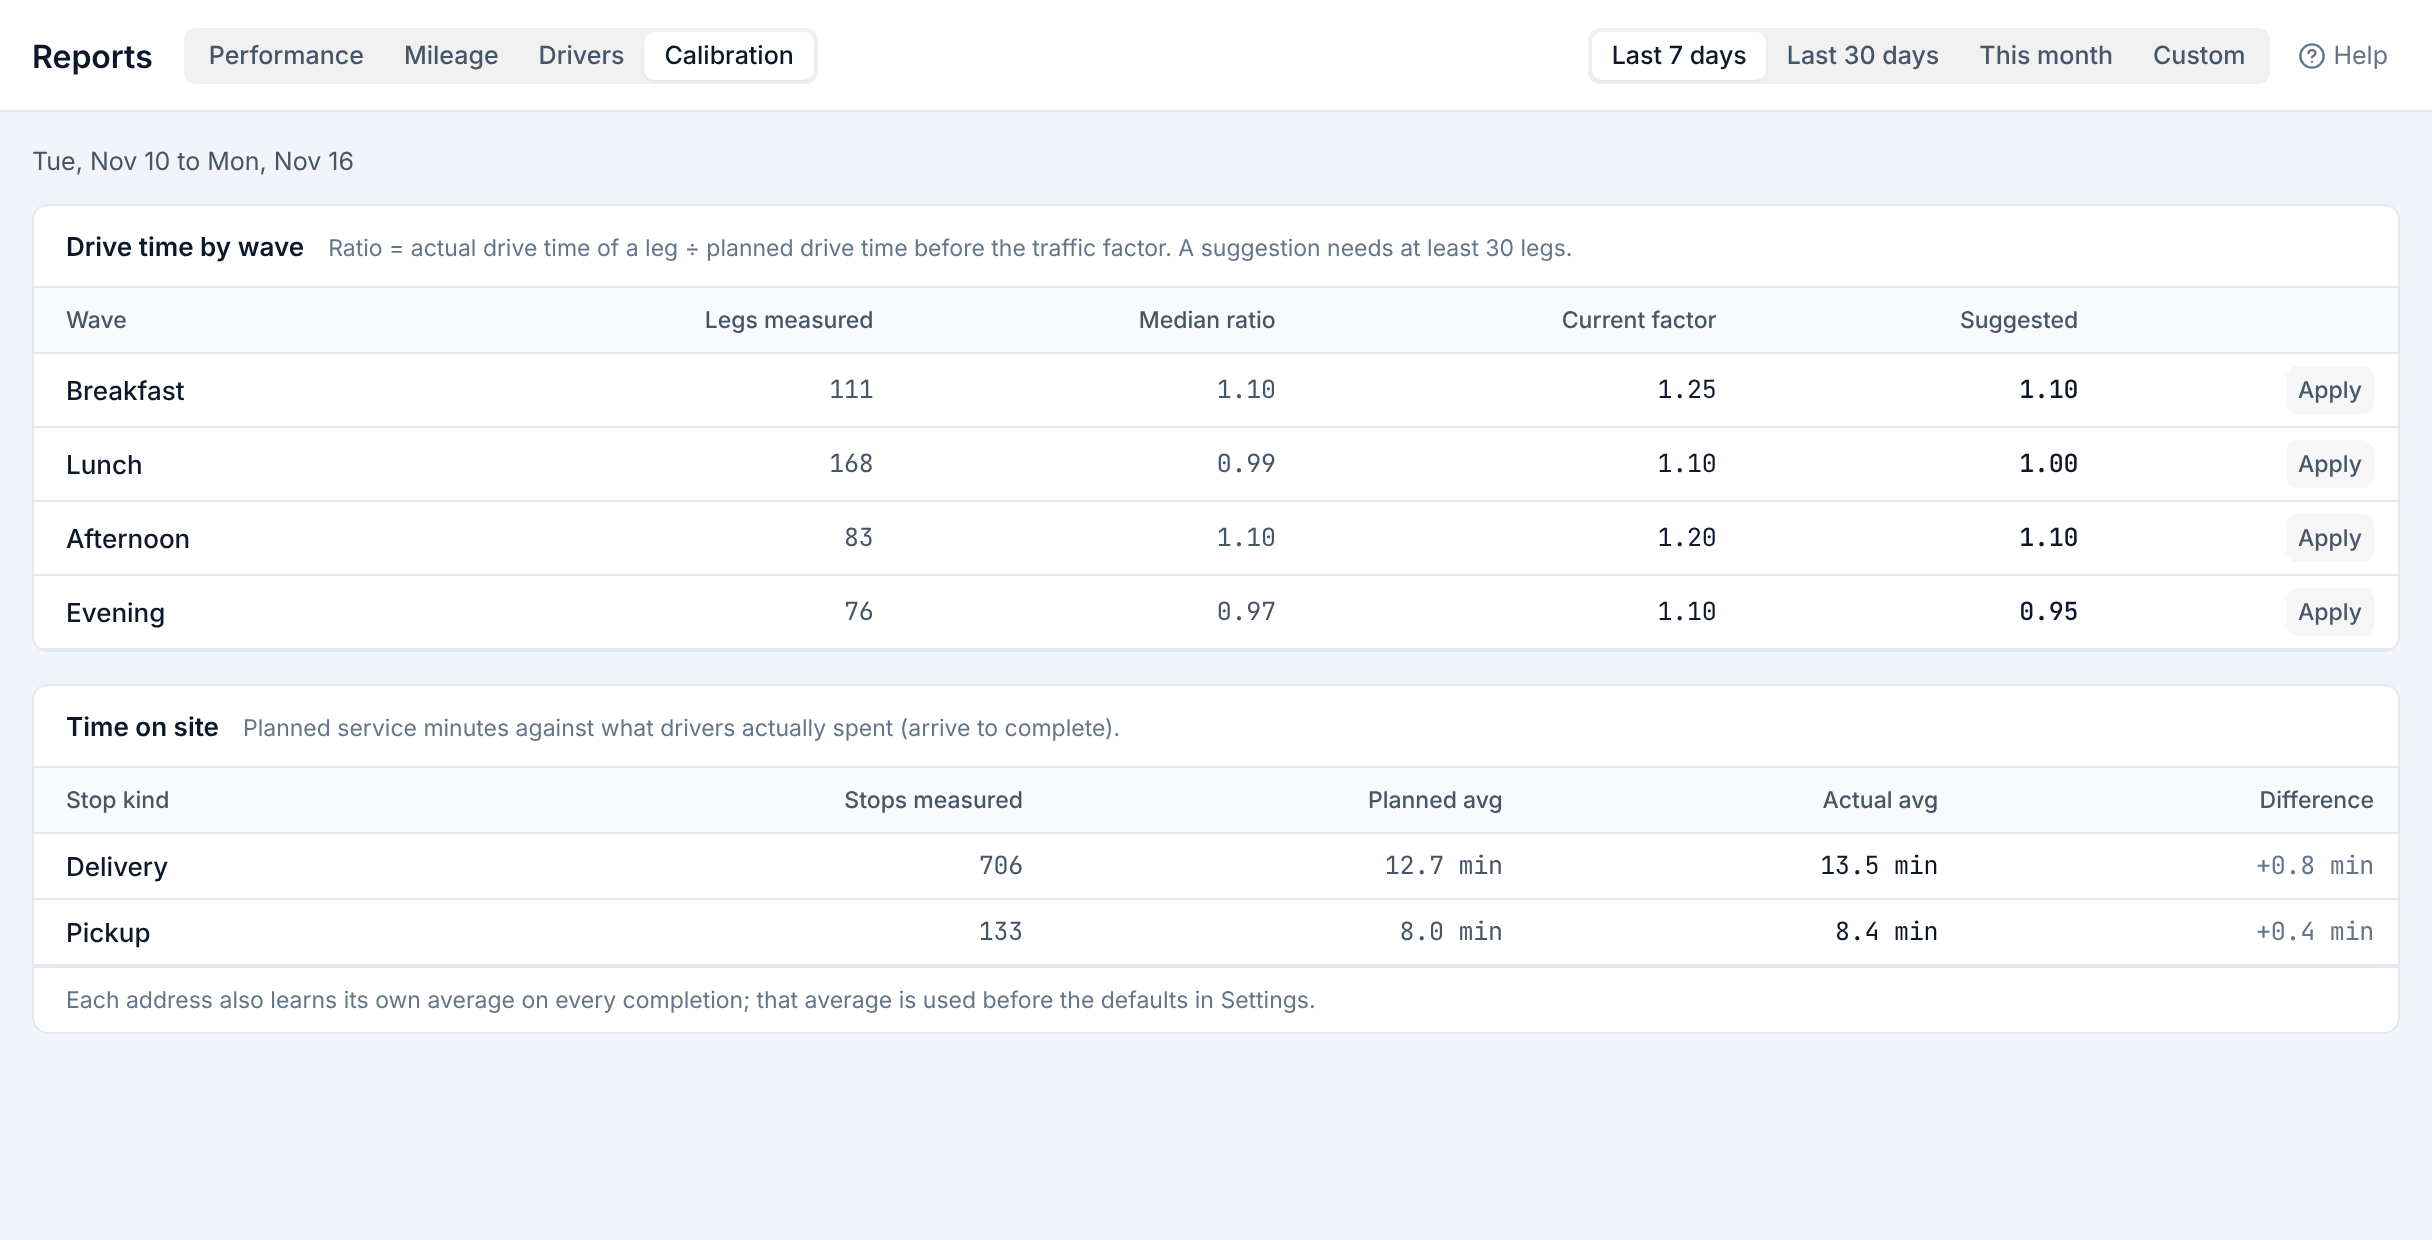
- Drive time by wave: for each wave, how many legs were measured and the median of actual drive time ÷ planned drive time before the traffic factor. With at least 30 legs measured, Routisserie suggests a new traffic factor for the wave (rounded to 0.05). Click Apply to use it; Up to date means the current factor already matches. Until then the column says how many more legs it needs.
- Time on site: planned minutes against what drivers actually spent (from arrive to complete), for deliveries and pickups. Each address also learns its own average automatically; there is nothing to apply.
Apply a suggestion when it has held for a couple of weeks, not after one unusual day.